Part 2: Length of Longest Run
Table 5: Largest run
| 1 | 2 | 3 | 4 | 5 | 6 | 7 | 8 | 9 | 10 | |
|---|---|---|---|---|---|---|---|---|---|---|
| Row 1 | 4 | 4 | 6 | 4 | 9 | 8 | 4 | 5 | 6 | 4 |
| Row 2 | 4 | 4 | 4 | 5 | 5 | 5 | 4 | 4 | 4 | 4 |
| Row 3 | 6 | 6 | 4 | 6 | 6 | 4 | 8 | 7 | 5 | 5 |
| Row 4 | 5 | 4 | 6 | 4 | 6 | 4 | 6 | 8 | 5 | 5 |
| Row 5 | 5 | 3 | 6 | 4 | 4 | 5 | 6 | 4 | 10 | 4 |
| Row 6 | 4 | 5 | 3 | 3 | 3 | 3 | 3 | 9 | 6 | 7 |
| Row 7 | 7 | 4 | 5 | 4 | 6 | 5 | 4 | 4 | 5 | 6 |
| Row 8 | 5 | 4 | 4 | 5 | 3 | 8 | 5 | 4 | 3 | 3 |
| Row 9 | 7 | 7 | 5 | 6 | 6 | 6 | 5 | 4 | 8 | 5 |
| Row 10 | 4 | 5 | 8 | 5 | 5 | 4 | 3 | 4 | 5 | 6 |
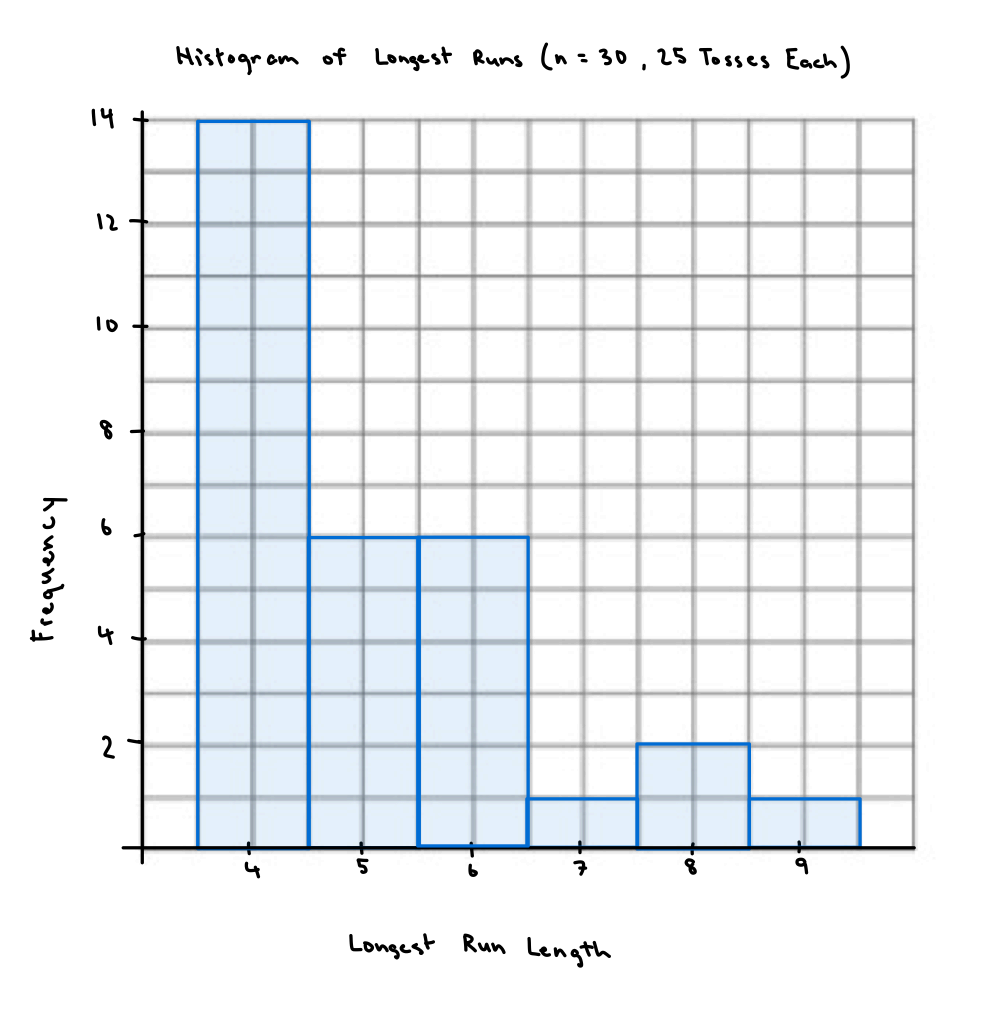
1 Histograms
- Histogram 1 (manual):
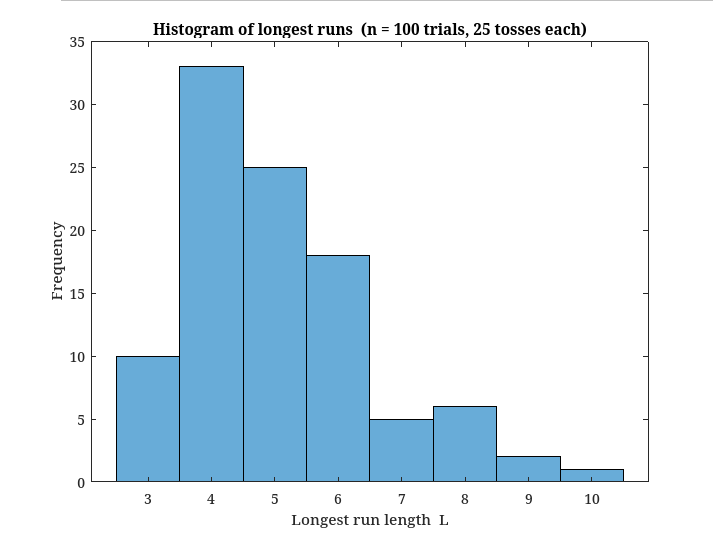
- Histogram 2
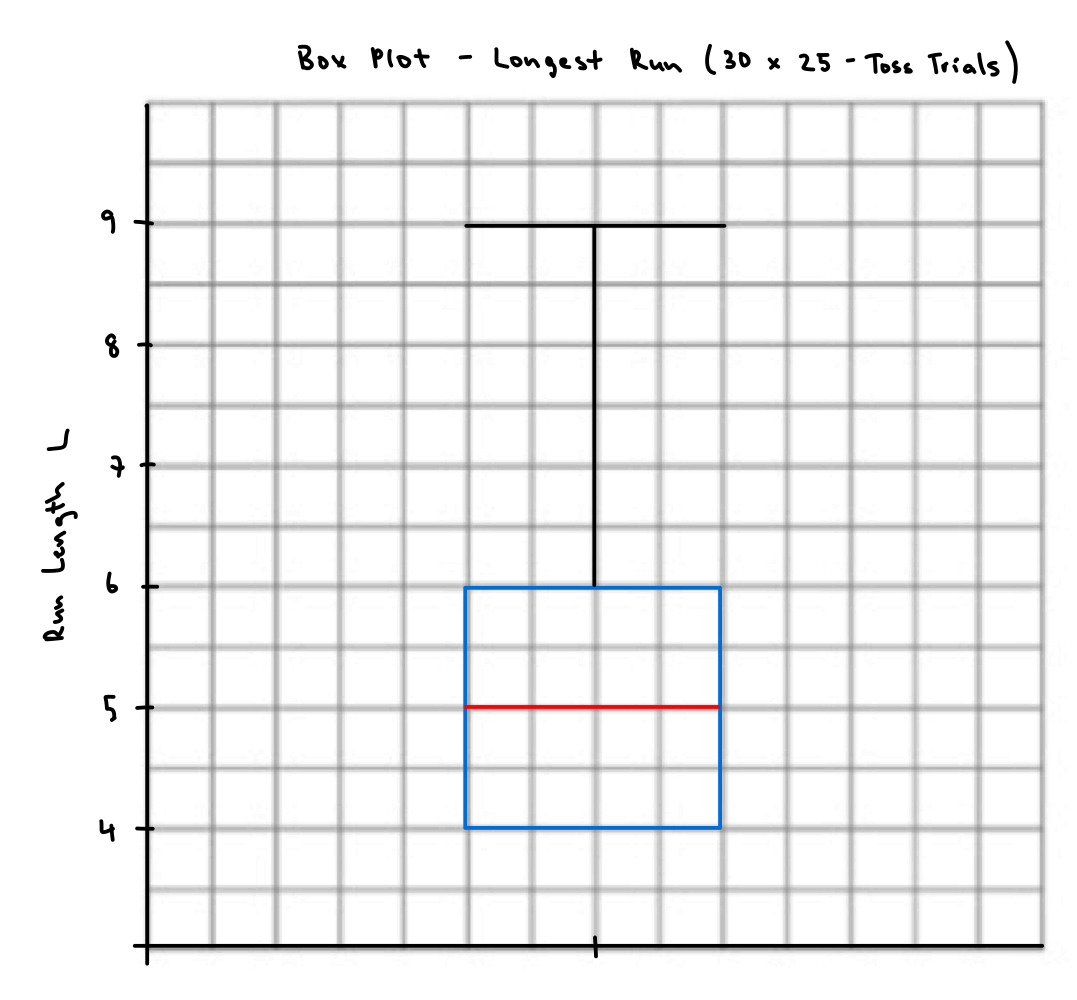
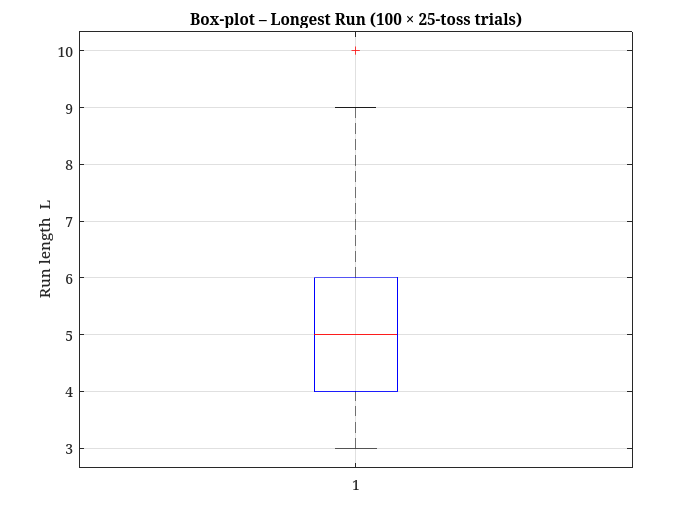
2 Box-plots
- manual
- full
3 Mean and Standard Deviation
4 Empirical PMF
| 3 | 4 | 5 | 6 | 7 | 8 | 9 | 10 | |
|---|---|---|---|---|---|---|---|---|
| Frequency | 10 | 33 | 25 | 18 | 5 | 6 | 2 | 1 |
| Probability | 0.10 | 0.33 | 0.25 | 0.18 | 0.05 | 0.06 | 0.02 | 0.01 |
5 95 % Percentile
Sort the 100 values → rank .
Both the 95th and 96th sorted values are 8