Lab 8 for ENSC 180
Code
function mse = dft_denoise(threshold)

% DFT denoising function

% Input:

% threshold - the denoising threshold

% Output:

% mse - Mean Squared Error

% Step 1: Reset RNG

rng('default');

% Step 2: Create clean signal

f1 = 1; f2 = 10; f3 = 20; % Frequencies in Hz

t = (0:255)/256; % Time vector

x0 = 3*sin(2*pi*f1*t) + cos(2*pi*f2*t) + 2*sin(2*pi*f3*t); % Clean signal

% Step 3: Create noisy signal

noise = randn(1, 256);

x_noisy = x0 + noise;

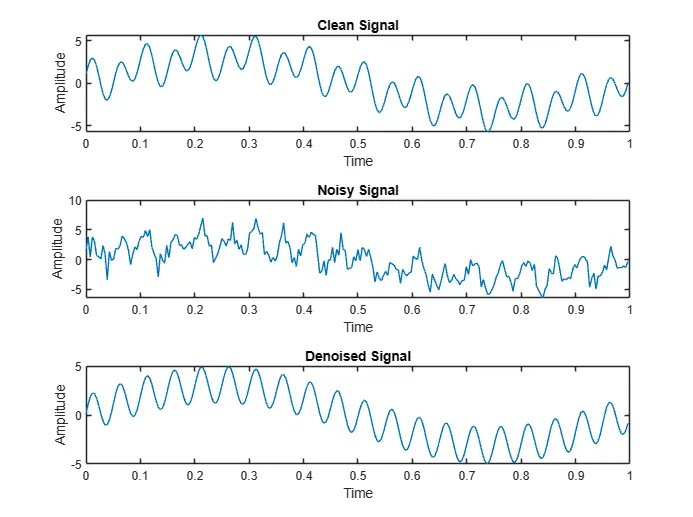
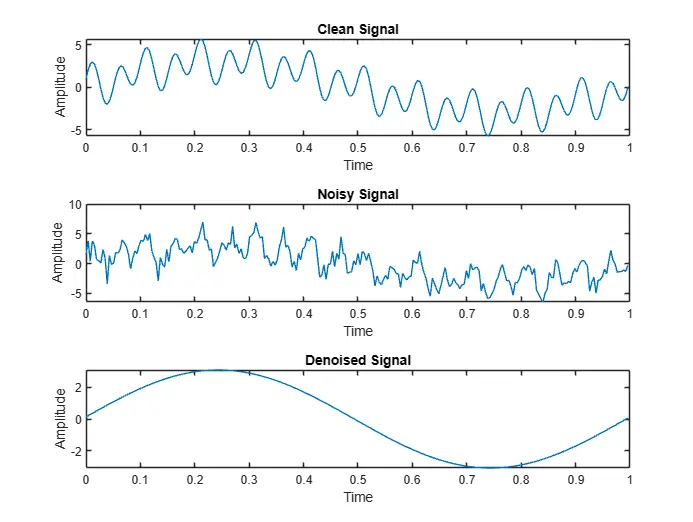
% Step 4: Plot clean and noisy signal

figHandle1 = figure; % Store figure handle for the first plot

fig1 = tiledlayout(3, 1);

nexttile;

plot(t, x0);

title('Clean Signal');

xlabel('Time');

ylabel('Amplitude');

nexttile;

plot(t, x_noisy);

title('Noisy Signal');

xlabel('Time');

ylabel('Amplitude');

% Step 5: Calculate DFT of the noisy signal

X = fft(x_noisy);

% Step 6: Compute magnitude of DFT

magnitude = abs(X);

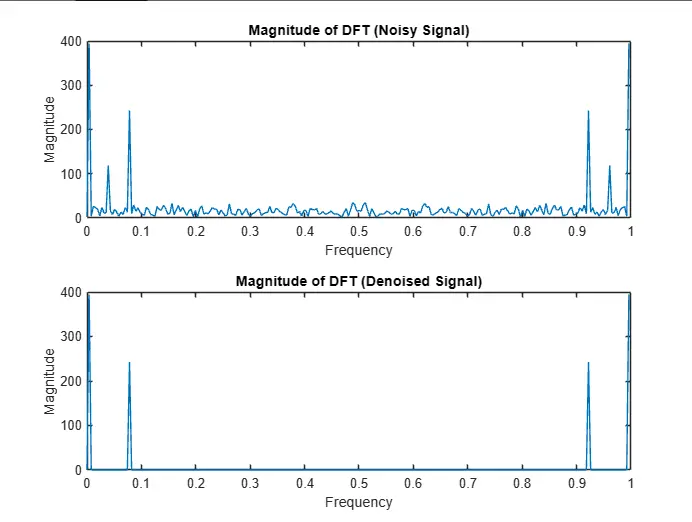
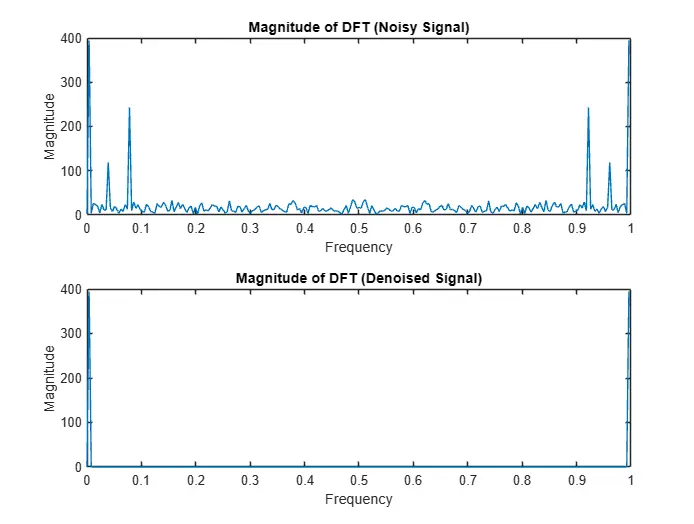
% Step 7: Plot DFT magnitude

figure; % Creating a new figure without needing its handle since it's the last figure

fig2 = tiledlayout(2, 1);

nexttile;

plot((0:255) / 256, magnitude);

title('Magnitude of DFT (Noisy Signal)');

xlabel('Frequency');

ylabel('Magnitude');

% Perform denoising

magnitude_denoised = magnitude;

magnitude_denoised(magnitude < threshold) = 0;

% Plot denoised DFT magnitude

nexttile;

plot((0:255) / 256, magnitude_denoised);

title('Magnitude of DFT (Denoised Signal)');

xlabel('Frequency');

ylabel('Magnitude');

% Step 10: Denoise complex DFT output

X_denoised = X;

X_denoised(abs(X) < threshold) = 0;

% Step 11: Inverse DFT to time domain

x_denoised = ifft(X_denoised);

% Step 12: Calculate MSE

mse = mean((x0 - x_denoised).^2);

disp(['Mean Squared Error: ', num2str(mse)]);

% Step 13: Plot denoised signal

figure(figHandle1); % Switch back to the first figure using its handle

nexttile;

plot(t, x_denoised);

title('Denoised Signal');

xlabel('Time');

ylabel('Amplitude');

end
Input 150
>>mse = dft_denoise(150);- runs it with 150 threshold
Output 150


Mean Squared Error: 0.51732
Input 250
>>mse = dft_denoise(250);- runs with 250 threshold
Output 250


Mean Squared Error: 2.5119
Explanation
Observing DFT Magnitude for Optimal Threshold
- Optimal threshold reduces noise, preserves signal.
- Specific threshold not directly observed in simulation.
Results
- Noise added to clean signal for analysis.
- DFT computes signal’s frequency domain representation.
- Observing magnitude reveals noise and signal frequencies.
- Thresholding eliminates low magnitude DFT components.
- Threshold choice critical for effective denoising.
- MSE measures fidelity of denoised signal to original.
- Identical MSE suggests threshold impact non-differential.