Lab 5 of ENSC 180
Complied code (because separating it would be meaningless)
% 1: Define a column vector of n including integers from 5 to 13.

n = (5:13)';

% 2: Calculate the factorials of all entries of the vector.

factorials_n = factorial(n);

% 3: Calculate the log10 of all n!.

log10_factorials_n = log10(factorials_n);

% 4: Combine the three column vectors into a table.

factorialTable = table(n, factorials_n, log10_factorials_n);

% 5: Change the titles of the three columns to n, n!, and log10(n!).

factorialTable.Properties.VariableNames = {'n', 'nFact', 'log10_nFact'};

% 6: Display the table content.

disp(factorialTable)

% 7: Create a figure for the two subfigures.

figure

tiledlayout('flow'); % Using 'flow' layout for the subplots.

% Plot (n, n!) curve.

nexttile

plot(n, factorials_n, '-o', 'LineWidth', 2, 'MarkerSize', 6, 'Color', 'b');

xlabel('n');

ylabel('n!');

title('Factorial Function');

grid on

% Plot (n, log10(n!)) curve.

nexttile

plot(n, log10_factorials_n, '-.*', 'LineWidth', 2, 'MarkerSize', 10, 'Color', 'r');

xlabel('n');

ylabel('log_{10}(n!)');

title('Logarithm of Factorial Function');

grid on
Output:
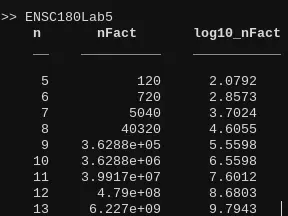
| n | nFact | Log10_nFact |
|---|---|---|
| 5 | 120 | 2.0792 |
| 6 | 720 | 2.8573 |
| 7 | 5040 | 3.7024 |
| 8 | 40320 | 4.6055 |
| 9 | 3.6288e+05 | 5.5598 |
| 10 | 3.6288e+06 | 6.5598 |
| 11 | 3.9917e+07 | 7.6012 |
| 12 | 4.79e+08 | 8.6803 |
| 13 | 6.227e+09 | 9.7943 |
- Again it isnt a table and this is the only way to make it look nice on this software so heres a screen shot

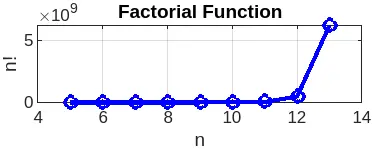
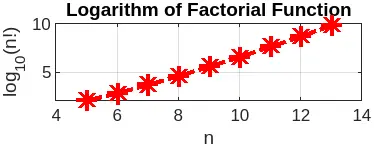
Figure output


8)
-
Discussion
- Graphically, by observing the function’s outputs, we can see that the logarithm would be a preferred choice as it is almost linear. Because of the original function, we do not get any fine-tuned numbers for the output because of the sudden massive spike. Due to this fact, we can safely say that the logarithm would be a better choice in comparison to the raw output.
Report/explanation
- the code essentially starts by defining a column vector n including integers from 5 to 13. It then calculates the factorial of each entry, followed by the logarithm (base 10) of these factorials. These values are combined into a table with customized column names.
- Finally, it plots two subfigures in one window: the first shows the factorial function itself (n versus n!), and the second shows the logarithm of the factorial function (n versus log10(n!))